The Nonprofit Pivot system is a research tool and a metric. We help you prepare and implement a plan, monitor its success and adapt it to changing times.
Assembling a local dashboard, which can be both a services menu and a monitor, is a specialty. Dashboard data is tailored to your areas of concern and presented in ways that can be easily understood and regularly updated. You select the information feeds most valuable to you, creating a dashboard that is unique. Nonprofits and government organizations using our services have the option of opening the dashboard to the public or requiring a password. Information is also made available in pdf format; online maps and graphics are designed to be embedded on other web sites or inserted in documents.
The example below is an amalgam of data from several Upstate communities.
Alerts
North Country suffers sharp decline in Canadian tourists
Catholic Charities Community and Family Services close refugee resettlement program
Grant tracker
💼 LOI – Greater Rochester Health Foundation
Submitted: March 1, 2025
Demographics
Population: 5,094
Housing snapshot (2022)
Housing unit change by block group (2020 → 2023)
Land use maps
Land use data
| Category | Parcel Count |
|---|---|
| Residential | 3,917 |
| Vacant Land | 293 |
| Commercial | 608 |
| Recreation & Entertainment | 14 |
| Community Services | 91 |
| Industrial | 28 |
| Public Service | 51 |
| Parks & Conservation | 2 |
| Total | 5,004 |
Timelines – historic, project progress, planning

Street maps
Funder connection maps

Business activity
Sales Tax Collections
(County, in millions)
First quarter 2024: $14.40
First quarter 2025: $14.26
% change: -0.9%
Budgeted village revenue, 2025: $130,000
New business formations
1/1-5/1/2025: 5 companies1/1-5/1/2024: 8 companies
1/1-5/1/2023: 6 companies
School district
Loading…
Students
School district map
Budget graphics
Building the framework
Gut check
First, we assess your needs. You tell us about shifting support, your funding sources, your needs, worries and hopes for the future.
We call this a “gut check.” When so many communities and community groups are experiencing deep cuts in federal funding and the threat of a distressed economy, some auxiliary services may have to be reduced or eliminated altogether. In many if not most instances, a complete transition from Washington to state, local, and individual support will be impossible. There will be a need to focus on core mission.
After this preliminary assessment, we work together to assemble the arrangement of our services that best meets your needs. These areas can include:
Funding
- Budgets – Graphic analysis of revenues & expenditures
- Collection & databasing of donor lists
- AI-assisted personalization of communications with donors
- Relationship mapping
- What ifs – custom-tailored simulators focusing on selected issues
- Alerts about prospect activities, contributions, financial transactions
- Identification of potential funders & collaborators
Profiling
What are the demographics of your community and/or your organization? Of your residents or audience?
You sense that housing or traffic are becoming an increasing problem. Perhaps you worry that the young people of your community have never fully recovered from the trauma of the pandemic.
Using journalistic skills honed over decades, we assemble data to provide greater insight into local challenges and patterns. Data is designed to be incorporated into comprehensive plans as well as grant applications.
Planning & reports
Nonprofit Pivot is ideally positioned to produce comprehensive plans, housing surveys, budget analyses, land-use studies, and other reports.
By combining current information, interactive graphics and simulations, and mapping, we help you create next-generation, living documents.
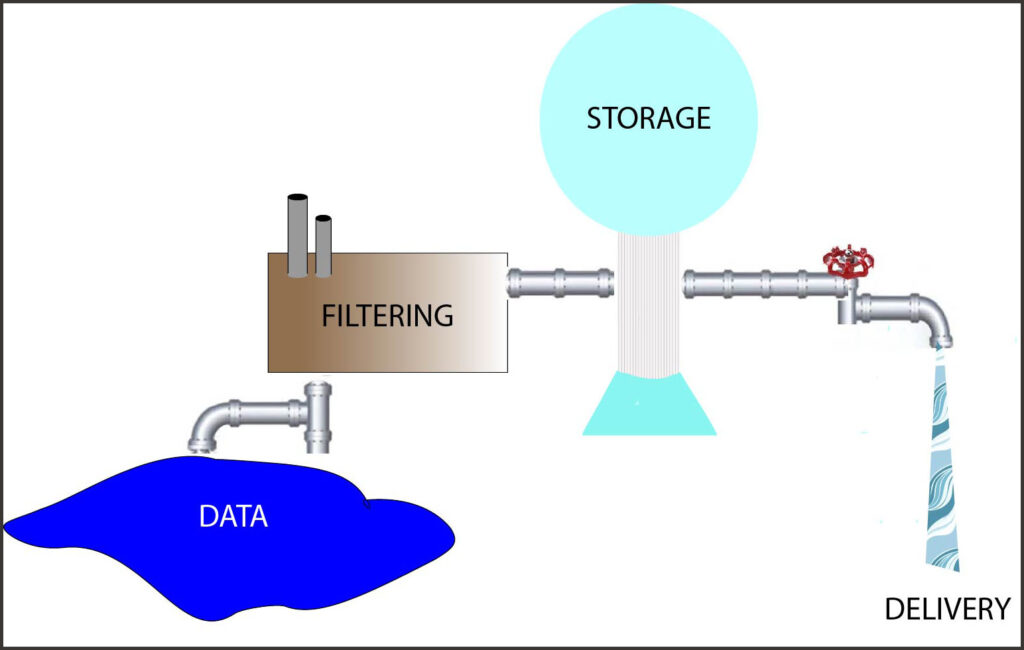
In short, we find the data, clean and organize it, install the pumps and lay the pipes. You turn the spigot.