Some things you can never fully plan for. The pandemic. Artificial intelligence. The breadth and depth of federal funding cuts.
The impact on our lives and our communities has exceeded expectations, even among the experts.
Staying abreast of trends and measuring the possible effects of change has never been more important. And never before have we had access to such powerful tools to aid us.
At Nonprofit Pivot, we believe in helping organizations, government bodies and communities across Upstate New York. We recognize that we’re at a tipping point – a rebirth borne of technology and remote workers moving back to areas that have suffered declining population and job opportunities for years.
These trends – for Upstaters who understand them and embrace them – mean improving quality of life and reuniting of families torn apart by young people’s need to go where the jobs are. For a region that is breathtakingly beautiful, rich in cultural and outdoor activities and affordable, this is a long-overdue, well-deserved turning of the tide.
We want to be part of that pivot, by moving nonprofit development and community planning into the next generation. Away from legacy systems and cut-and-paste plans that cost tens of thousands of dollars. Toward in-depth research; timely data; interactive publishing; graphical displays, and artificial intelligence.
Source: NYS Department of Labor.
There’s no longer any reason for costly comprehensive plans to be thick publications that gather dust on shelves. They should be living documents – available and relevant not only to government commissions or nonprofit boards, but to the people they serve.
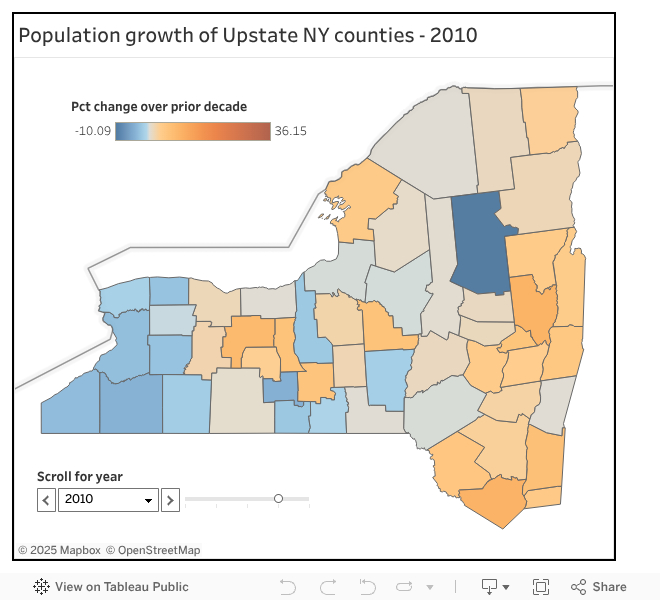
The map above demonstrates how data and mapping can be melded into an engaging presentation of county population changes, from one census to the next. Roll your mouse over the counties for more data. Use the slider to move from one decade to the next. Data can be mapped at a wide range of geographies, including counties, cities, towns, villages, coverage areas and census block groups.
While the map looks at past patterns, our AI-assisted simulators offer predictive modeling, zeroing in on factors such as remote workers, housing and other features of community life. Clients of Nonprofit Pivot receive in-depth data and forecasting tools tailored to their needs.
We want to help make comprehensive planning an ongoing process that helps communities and nonprofits adapt to and take advantage of rapid change. Please try our free simulators, and contact us for more information.